Phased array antenna pattern-Part 1: Linear array beam characteristics and array factor
“Although digital phased arrays continue to grow in commercial and aerospace and defense applications, many design engineers do not know much about phased array antennas. Phased array antenna design is not a new thing. After decades of development, this theory has been quite mature. However, most of the literature is only suitable for antenna engineers who are proficient in electromagnetic mathematics. As phased arrays begin to include more mixed signals and digital content, many engineers can benefit from more intuitive phased array antenna pattern descriptions. It turns out that there are many similarities between the behavior of phased array antennas and the mixed-signal and discrete-time sampling systems that digital engineers deal with every day.
“
Introduction
Although digital phased arrays continue to grow in commercial and aerospace and defense applications, many design engineers do not know much about phased array antennas. Phased array antenna design is not a new thing. After decades of development, this theory has been quite mature. However, most of the literature is only suitable for antenna engineers who are proficient in electromagnetic mathematics. As phased arrays begin to include more mixed signals and digital content, many engineers can benefit from more intuitive phased array antenna pattern descriptions. It turns out that there are many similarities between the behavior of phased array antennas and the mixed-signal and discrete-time sampling systems that digital engineers deal with every day.
The purpose of this series of articles is not to train antenna design engineers, but to show the impact of their work on the pattern of phased array antennas to engineers who use phased array subsystems or devices.
Beam direction
First, let’s take a look at an intuitive phased array beam steering example. Figure 1 is a simple diagram depicting the wave fronts shooting from two different directions to four antenna elements. There will be a delay behind each antenna element on the receive path, after which all four signals are summed together. In Figure 1a, this delay is consistent with the time difference between the wavefront’s arrival at each element. In this example, the resulting delay will cause the four signals to arrive at the merge point in phase. This consistent combination will enhance the signal output by the combiner. In Figure 1b, the resulting delay is the same, but in this example, the wavefront is perpendicular to the antenna element. The current delay is inconsistent with the phases of the four signals, so the combiner output will be greatly attenuated.
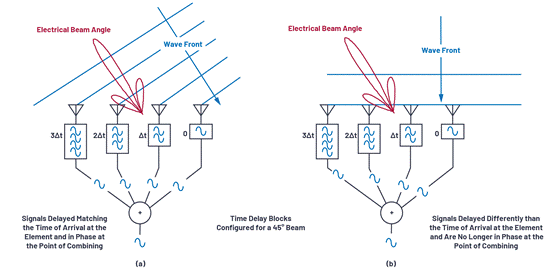
Figure 1. Understanding the steering angle.
In a phased array, delay is a quantifiable variable required for beam steering. But it is also possible to simulate delay by phase shifting, which is a very common and practical approach in many implementations. We will discuss the effects of delay and phase shift in the section about beam squint, but for now we will first understand the phase shift implementation, and then derive the beam steering calculation for the corresponding phase shift.
Figure 2 shows a phased array arrangement that uses a phase shifter instead of a delay. Please note that we define the direction of the line of sight (θ = 0°) as perpendicular to the front of the antenna. The right side of the line of sight is defined as a positive angle θ, and the left side of the line of sight is defined as a negative angle.
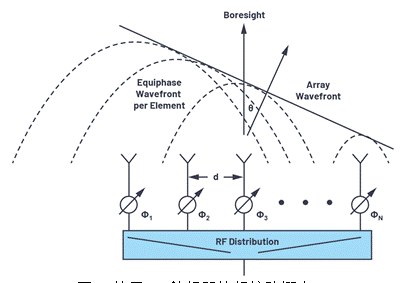
Figure 2. Phased array concept using RF phase shifters.
To show the phase shift required for beam steering, a set of right triangles can be drawn between adjacent elements, as shown in Figure 3. Among them, ΔΦ represents the phase shift between these adjacent elements.
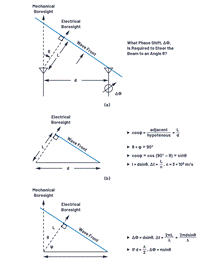
Figure 3. Derivation of phase shift ΔΦ and beam steering angle.
Figure 3a defines the triangle identity between these elements, and the distance between each element is represented by (d). The beam points in the direction away from the line of sight θ, and the angle of the beam from the line of sight is φ. In Figure 3b, we see that the sum of θ and φ is 90°. In this way, we can calculate L, because L = dsin(θ), and L represents the variable distance of wave propagation. The delay required for beam steering is equal to the time it takes for the wavefront to traverse the distance L. If L is considered as a fraction of the wavelength, the phase delay can be replaced by this delay. The ΔΦ equation can be defined relative to θ, as shown in Figure 3c and repeated calculations in Equation 1.
![]()
If the component spacing is exactly half of the signal wavelength, it can be further simplified as:
![]()
We use specific examples to calculate these equations. Assume that the two antenna elements are separated by 15 mm. If a 10.6 GHz wavefront arrives at an angle of 30° from the mechanical line of sight, what is the optimal phase shift between these two elements?
・ Θ = 30º = 0.52 rad
・ Λ = c/f = (3 × 10⁸ m/s)/10.6 GHz = 0.0283 m
・ ∆Φ = (2π × d × sinθ)/λ = 2π × 0.015 × sin(0.52)/0.0283 m = 1.67 rad = 95º
Therefore, if the wavefront arrives at θ = 30° and the phase of adjacent elements is shifted by 95°, the respective signals of the two elements can be superimposed uniformly. In this way, the antenna gain in this direction can be maximized.
To better understand how the phase shift changes with the beam direction (θ), Figure 4 graphically plots these equations under different conditions. Some interesting phenomena can be observed from these figures. For example, when d = λ/2, the slope near the line of sight is approximately 3:1, which is the multiplier π in Equation 2. This situation also demonstrates that a complete phase shift of 180° between components will result in a theoretical phase shift of 90° in the beam direction. In fact, this is impossible to achieve in a real component pattern, but the equation does show a theoretical ideal value. It should be noted that when d> λ/2, there is no phase shift that can provide a complete beam shift. In a later article, we will introduce that this situation will lead to grating lobes in the antenna pattern. This figure is the first time that the behavior is different when d> λ/2.
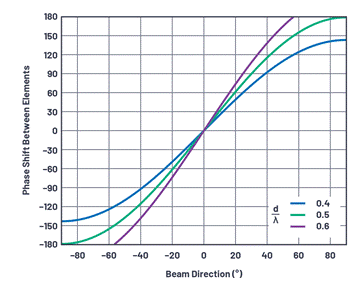
Figure 4. The relationship between the phase shift ΔΦ between the components and the beam direction (θ) for the three d/λ cases.
Equally spaced linear array
The equation derived above only applies to two elements. But the actual phased array may contain thousands of spaced-apart elements in two dimensions. But for the purposes of this article, we only consider one dimension: linear arrays.
The linear array is the width of the single element, which contains N elements. Different linear arrays may have different intervals, but the same linear array is usually equally spaced. Therefore, in this article, we set the spacing between each element to a uniform distance d (Figure 5). Although the equidistant linear array model is a simplified version, it basically introduces how the antenna pattern is formed and various conditions. We can further use the principle of linear arrays to understand two-dimensional arrays.

Figure 5. Equally spaced linear array (N = 4).
Near field and far field
How to apply the formula derived above for the linear array of N = 2 to the linear array of N = 10,000? Now, it seems that each antenna element points to the spherical wavefront at a slightly different angle, as shown in Figure 6.
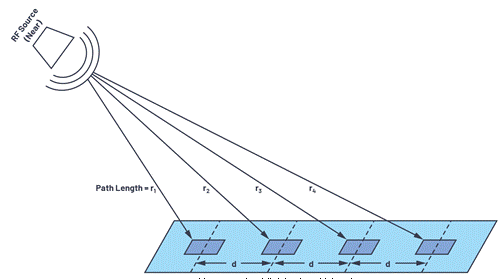
Figure 6. The RF signal source is closer to the linear array.
If the RF source is closer, the incident angle of each element is different. This situation is called the near field. We can calculate all these angles, and sometimes we need to do this for antenna testing and calibration, because our test device can only be this large. But if the RF source is far away, it is the situation shown in Figure 7.
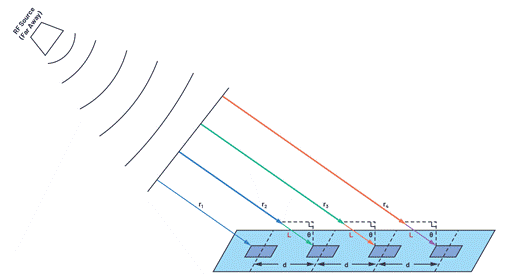
Figure 7. The RF signal source is far away from the linear array.
If the RF source is far away, the large radius of the spherical wavefront will result in roughly parallel wave propagation paths. Therefore, all beam angles are equal, and the path length (L = d × sinθ) of each adjacent element exceeds the barrier element. This simplifies the mathematical calculations, which means that the two-element equation we derived can be applied to thousands of elements, but only if these elements have the same spacing.
But under what circumstances can far-field assumptions be made? How far is the far field? Although slightly subjective, in general, the far-field definition exceeds:
![]()
Among them, D represents the diameter of the antenna ((N-1) × d for an equally spaced linear array)
For small arrays (small value of D) or low frequency (large value of λ), the far field distance is small. But for large arrays (or high frequencies), the far field distance can be as long as several kilometers! This makes it very difficult to test and calibrate the array. For such cases, a more detailed near-field model can be used, and then scaled to the far-field array used in the real world.
Antenna gain, directivity and aperture
Before going any further, it is useful to understand the definitions of antenna gain, directivity, and aperture. First introduce gain and directionality, because these two concepts are often used interchangeably. Antenna gain and directivity are compared to isotropic antennas, which are ideal antennas that radiate uniformly in all directions. Directivity refers to the ratio of the maximum power Pmax measured in a specific direction to the average power Pav radiated in all directions. If the direction is not defined, the directionality is determined by Equation 4. /p>

When comparing antennas, directivity is a useful indicator because it defines the ability to concentrate radiated energy. The gain is the same as the directivity pattern, but the gain includes the antenna loss.

Prad is the total radiated power, Pin is the power input to the antenna, and k represents the loss in the antenna radiation process.
Next, we treat the antenna pattern as a function of the three-dimensional direction, and the directivity as a function of the beam width.
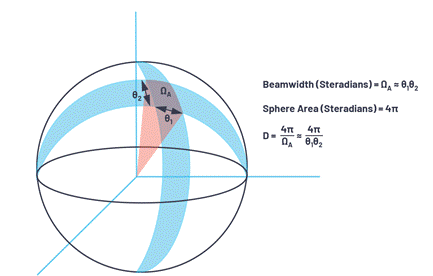
Figure 8. A three-dimensional view of the area projected onto the sphere.
The total surface area of a sphere is 4π2, and the area on the sphere is defined in units of steradian, which is equal to 4π steradian in the sphere.Therefore, the power density from the isotropic radiator is

The unit used is (W/m2).
An area on the sphere has two angular directions. In radar systems, these two angular directions are usually called azimuth and elevation. The beam width can be described as a function of each angular direction (θ1 and θ2): this combination will form an area ΩA on the sphere.
ΩA is the beam width expressed in steradian units, which can be approximated as ΩA ≈ θ1 × θ2.
After confirming that ΩA is the area on the sphere, the directivity can be expressed as

The third antenna term we will consider is aperture. The antenna aperture represents the effective area for receiving electromagnetic waves, and includes a function with respect to wavelength.The aperture of the isotropic antenna is

The gain is relative to the isotropic antenna, the resulting effective antenna aperture is

Combining the three terms, the gain can be regarded as a function of the angle defining the radiation pattern, which represents the efficiency (or loss) in the antenna.
Array factor of linear array
Currently, we can predict the optimal time (or phase) variation between elements to achieve maximum antenna directivity. But we need to understand and operate the complete antenna gain pattern. This is divided into two main aspects. First, each individual element of the array (perhaps a patch) has a gain, which is called the element factor (GE). Secondly, the gain effect will be produced by array beamforming, which is called the array factor (GA). The full-array antenna gain pattern is a combination of these two factors, as shown in Equation 10.

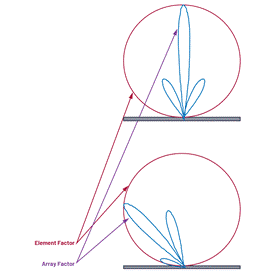
Figure 9. Element factor and array factor.
Figure 9. Element factor and array factor. GE represents the radiation pattern of a single element in the array. Its definition depends on the geometry and structure of the antenna, rather than factors that will change during operation. It is important to know this, because it will limit the gain of the total array-especially near eye level. But since we don’t use Electronic control, it can be kept constant as an influencing factor of the total phased array gain equation. In this article, we assume that all independent components have the same component factor.
Next, we will focus on the array factor GA. The calculation of the array factor is based on the array geometry (d stands for an equally spaced linear array) and beam weights (amplitude and phase). It is very simple to derive the array factor of an equally spaced linear array, but the relevant content is described in detail in the references cited at the end of this article.
The equations used in the literature vary, depending on how the linear array parameters are defined. We use the equations in this article to align with the definitions in Figure 2 and Figure 3. Since the main problem is how the gain changes, it is usually more instructive to plot normalized array factors relative to unity gain. The normalized array factor can be written as Equation 11.
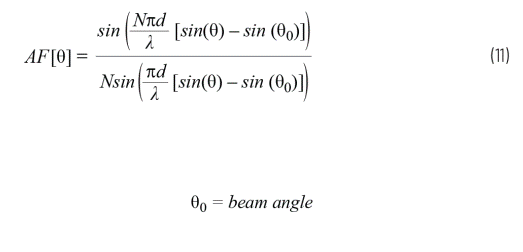
We have defined the beam angle θ0 as a function of the phase shift between elements θ0; therefore, we can also write the normalized antenna factor as Equation 12

The conditions assumed in the array factor equation include:
・ The component pitches are equal.
・ The phase shift between the elements is the same.
・ The amplitude of all components is the same.
Next, we use these equations to plot array factors for various array sizes.
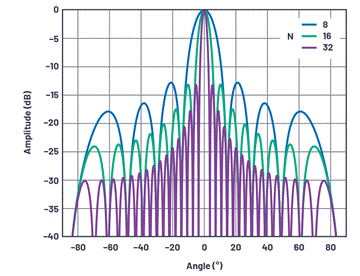
Figure 10. The normalized array factor at the line of sight of the linear array, where the element spacing is d = λ/2, and the number of elements is 8, 16, and 32, respectively.
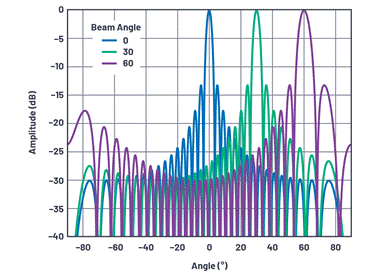
Figure 11. Normalized array factor for a 32-element linear array at various beam angles, where the element spacing is d = λ/2.
The following points can be observed from these data:
・ The first side lobe is at C13 dBc, regardless of the number of components. This is determined by the sinc function in the array factor equation. The side lobe can be improved by gradually reducing the gain in the component. This topic will be explored in the follow-up content of this series.
・ The beam width decreases with the number of components.
・ The farther the scanned beam is from the line of sight, the wider the beam width.
・ The number of zero points increases as the number of components increases.
Beam width
The beam width is an indicator of the angular resolution of the antenna. The most common is to define the beam width by the half-power beam width (HPBW) or the zero-to-zero interval of the main lobe (FNBW). To find HPBW, move 3 dB down from the peak and measure the angular distance, as shown in Figure 12.
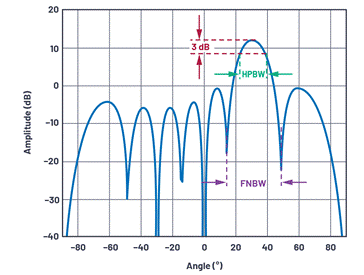
Figure 12. Definition of antenna beam width (linear array shown is N = 8, d = λ/2, θ = 30°).
Using our standardized array factor equation, this HPBW can be solved by setting equation 3 equal to the half power level (3 dB or 1/√2). We assume the mechanical line of sight (θ = 0°), N = 8 and d = λ/2.

Then solve for ∆Φ to get 0.35 rad. Use Equation 1 and solve for θ:

This θ is the peak value that reaches the 3 dB point (that is, half of HPBW). Therefore, we only need to multiply it by 2 to get the angular distance between the 3 dB points. This results in a HPBW of 12.8°.
We can repeat this calculation for an array factor equal to 0, and obtain the first zero-to-zero interval angle FNBW 28.5° under the conditions described above.
For equally spaced linear arrays, Equation 15 can calculate HPBW [1,2]Approximate value.

Figure 13 plots the beam width and beam angle for various element numbers under the condition of λ/2 element spacing.
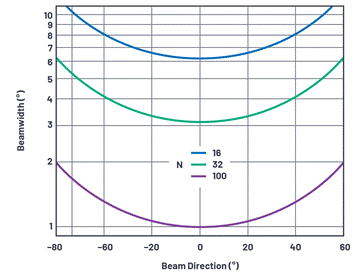
Figure 13. The beam width and beam angle with a component spacing of λ/2 when the number of components is 16, 32, and 100.
In this figure, it is worth noting some observations related to the size of the array being developed in the industry.
・ 1° beam accuracy requires the presence of 100 components. If both azimuth and elevation angles have this requirement, an array containing 10,000 elements will be produced. 1° accuracy will only appear at the line of sight under near-ideal conditions. In the field array, to maintain 1° accuracy in a variety of scanning angles, the number of components will be further increased. This observation will set a practical limit for the beam width for very large arrays.
・ An array of 1000 elements is a common array in the industry. If there are 32 elements in each direction, there are a total of 1024 elements, and a beam accuracy of less than 4° will be produced near the line of sight.
・ The array of 256 elements can be mass-produced at low cost and still has a beam pointing accuracy of less than 10°. This may be an ideal choice acceptable for many applications.
・ It should also be noted that for any of the above cases, the beam width will be doubled at a 60° offset. This is because there is cosθ in the denominator, which is affected by the reduction of the array projection; that is, when viewed from a certain angle, the array looks like a reduced intersection.
Combination element factor and array factor
Only the array factor was considered in the previous section. But in order to find the total antenna gain, an element factor is also required. Figure 14 depicts an example. In this example, we use a simple cosine shape as the element factor, or normalized element gain GE(θ). Cosine roll-off is very common in phased array analysis. If you are considering a plane, you can Display it. On the broad side, there is a maximum area. As the angle moves away from the broadside, the visible area decreases with the cosine function.
In the above λ/2 interval, uniform radiation pattern, linear array with 16 elements, the array factor GA(θ) is used. The total pattern is the linear product of the element factor and the array factor, so they can be added using a dB scale.
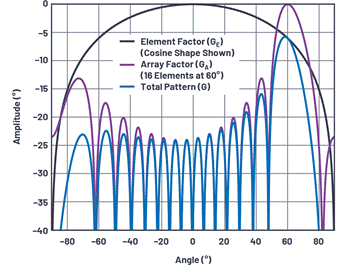
Figure 14. The element factor and array factor are combined to form the total antenna pattern.
Some observations as the beam moves away from the line of sight:
• The amplitude of the main beam is attenuated at the rate of the component factor.
・ There is no loss of amplitude for the side lobes on the aiming line.
・ The sidelobe performance of the overall array is reduced when the principle is on the line of sight.
Antenna drawing: Cartesian and polar coordinates
The currently used antenna pattern drawing has always adopted Cartesian coordinates. However, it is also common to draw antenna patterns in polar coordinates because they are easier to represent the energy radiated from the antenna to the outer space. Figure 15 is a redrawn version of Figure 12, but using polar coordinates. Please note that the data used is exactly the same, but it is redrawn in the polar coordinate system. It is very meaningful to be able to present the antenna pattern in either representation method, because both systems are used in the literature. In most of this series, we will use Cartesian coordinates because this representation method makes it easier to compare beamwidth and sidelobe performance.
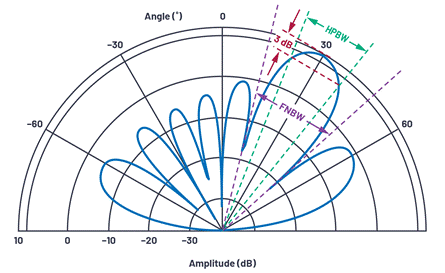
Figure 15. Polar coordinate antenna directivity plot with N = 8, d = λ/2, θ = 30°.
Array interaction
Up to now, all illustrations and text describe the signal received by the array. So what is the difference with the launch array? Fortunately, most antenna arrays have interaction relationships. Therefore, all diagrams, equations and terminology of the receiving antenna are the same as those of the transmitting antenna. Sometimes it is easier to understand the beam as being received by the array. Sometimes, for example, in terms of grating lobes, it may be more intuitive to think of the array as a transmitting beam. In this article, we usually describe the array as receiving a signal. But if it’s hard for you to imagine, you can also think about the same concept from a launch perspective.
summary
This concludes Part 1 of this series. This article introduces the concept of phased array beam steering. Derive and graphically show the equations used to calculate the phase shift of the array for beam steering. Then by observing the influence of the number of elements, element spacing and beam angle on the antenna response, the array factor and element factor are defined. Finally, a comparison of the antenna pattern in Cartesian and polar coordinates is shown.
In subsequent articles in this series, we will further discuss phased array antenna patterns and impairments. We will study how the narrowing of the antenna causes the side lobes to shrink, how the grating lobes are formed, and the effects of phase shift and delay in broadband systems. At the end of this series, we will analyze the limited resolution of the delay block and introduce how it forms quantized sidelobes and reduces beam resolution.
The Links: CLK100AA160 LQ084V1DG42


